
Graphical Dashboard Widgets for WordPress v1.1 Free Download
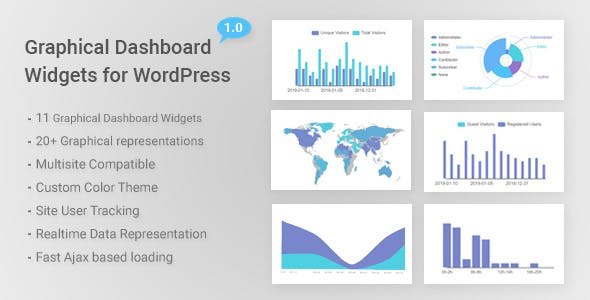
Graphical Dashboard Widgets for WordPress v1.1 is a collection of wide range of dashboard widgets. These widgets display realtime data of your site in graphical or chart form. There are total 11 widgets with our 20+ graphs. Graphical statistics regarding users and site visitors, pages, posts, comments, user location, browser, platform, post category, online users etc. are represented on your dashboard. You can also download
Following below are the details of various dashboard widgets
There are total 11 categories of graphical dashboard widgets in this plugin. Each widget has one or more graphs representing respective information in graphical form. Following are the details of each widget:
1.) Visitors in last 15 days A graph showing information regarding the visitors visited on your site in last 15 days. It shows comparison ratio of total count of unique visitors by total visits on your site in last 15 days. It helps in keeping track of new and revisiting users on your site.
2.) Users in last 15 days A graph showing information regarding the users on your site in last 15 days. It shows comparison of the total count of visits by guest visitors and registered users on your site in last 15 days.
3.) Browsers Used There are 2 graphs in this widget. First graph shows the total count of browser used by users to visit your site in last 15 days. It shows the comparison of different browsers used.
Second graph shows the daily info of browsers used based on date. Browsers are categorized as in group as Google Chrome, Firefox, Safari, Opera, Internet Explorer and Other. This graph shows the comparison of browser used by users to visit your website.
4.) Platforms Used There are 2 graphs in this widget. First graph shows the total count of platform used by users to visit your site in last 15 days. It shows the comparison of different platforms used.
Second graph shows the daily info of platforms used based on date. Platforms are categorized as in group as Apple, Windows, Linux, Android and Others. This graph shows the comparison of platform used by users to visit your website.
5.) Visits by country This widget shows a count of users from various countries visited in last 30 days. This helps in comparing the location of users visiting your site.
6.) Today Page Views & Online Users This widget shows the users on your site of current day by hours. User counts are divided by every 2 hours. It also shows the users currently online on your site.
7.) Page Count and Type This widget displays a donut chart showing the count of each page type on your site. Published, Draft, Pending, Private etc. categorizations of page are shown in the graph.
8.) Post Statistics There are 3 graphs in this widget. First graph shows count of posts by month in each year. This helps in keeping track of number of posts published on your site in each month and year. Second graph shows the total count of posts published in each year. Third graph shows a donut chart showing the count of each post type on your site. Published, Draft, Pending, Private etc. categorizations of posts are shown in the graph.
9.) User Comment This widget displays a donut chart showing the count of each comment type on your site. Approved, Spam, Trash, Pending etc. categorizations of comments are shown in the graph.
10.) Category Statistics There are 2 graphs in this widget. These graphs shows count of posts in each category. First graph shows the most used post categories (means categories with most number of posts). Second graph shows the least used categories (means categories with least number of posts).
11.) User Statistics There are 3 graphs in this widget. First graph shows count of users by month in each year. This helps in keeping track of number of users registered on your site in each month and year. Second graph shows the total count of users registered in each year. Third graph shows a donut chart showing the count of each user role on your site. Administrator, Subscriber, Editor etc. categorizations of users are shown in the graph.